Many data scientists are former academics who are used to working on a specific and often quite narrow research problems for long periods of time, often years. With data science being in high demand at the moment in nearly all industries, more and more researchers switch from an academic career to one in the private sector and all off a sudden they get bombarded with the same question over and over again:
How much is this project going to cost and how long do you think it will take?
When I was asked the ‘How long is it going to take?’ question in the past, I usually replied something along the lines of: ‘Hard to say, a data science project is a science project after all and if you know the answer beforehand, it is not science’.
However, it got me thinking:
How can we structure a data science project in a way to manage and communicate the uncertainty involved and at the same time allow freedom of exploration that is necessary in any science project?
Data science is part of the IT department at the place I work and my software engineering colleagues all work and plan their projects using Scrum, an agile development framework. Since I am not a software engineer by training I had no clue what ‘agile development’ was about, but it sounded interesting. Fast forward to today: we are now using a slightly modified version of Scrum for our data science projects and we like it a lot.
In the next section I want show you how we customized the scrum framework for data science:
Agile Data Science Framework
At the end of this section you will know:
- How to break a complex project down into manageable parts
- How to distribute and delegate work between team members
- How to measure your progress effectively
We will discuss how to use Visual Studio Team Services (VSTS), but there are lots of other tools out there that you can use as well. VSTS offers more or less the same functionality as Github, but offers a lot of additional tooling that helps you setup continuous delivery pipelines and agile project management tools.
A very good and comprehensive resource is the Team Data Science Process from Microsoft. We used the included template as a starting point to develop our own.
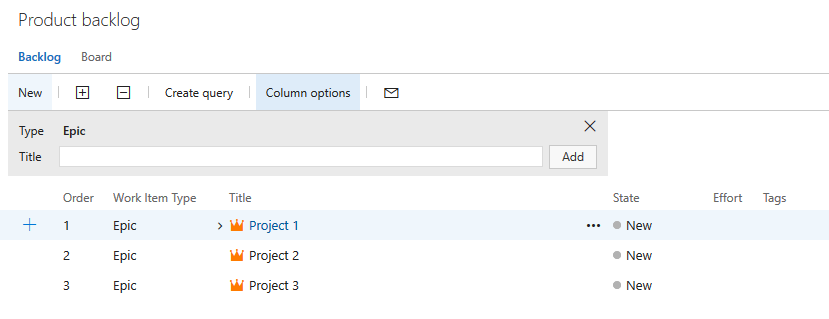
We setup one development team in VSTS to host all of your projects. Our backlog looks like this:
We manage individual data science projects using epics. While it is possible to use separate project teams in VSTS to manage your work each with its own backlog, we would advise against it except if your data science teams are quite large and work independently. At the time of this writing VSTS does not support capacity planning across different teams. So you would need to track capacity manually and that can become quite a lot of work if your team works on lots of small projects at the same time.
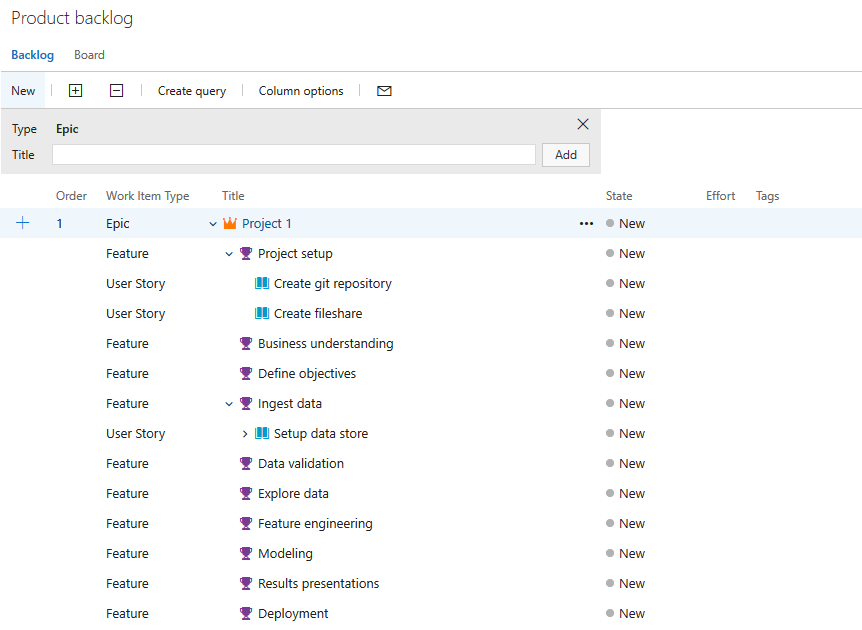
In a next step, we use the following features to structure the data science development cycle:
We try to stick to this general structure if possible so that we can compare the complexity and effort of the same phases in different projects, i.e. so we can do data science on data science projects:)
The ordering of the features roughly reflects a typical project life-cylce from start to finish.
In a next step, we start to write user stories for all features that are relevant for the first sprint. Usually, the project lead writes the user stories and the begins writing tasks for them.
Sprint planning looks like this:
As you can see, we start to write specific actionable tasks to complete the associated user story. The complexity of each user story is estimated based on story points, relative to a standard complexity of 3pts. Each user story is assigned to one person that is responsible for its timely completion. The person responsible for the user story sometimes does all the necessary work alone, but can also delegate tasks. For each task we estimate the amount of hours we think are necessary to complete the task. If a task takes longer than 8h, we break it up into subtasks.
On the right side of the screenshot you can see an overview of total available team capacity and how much work is assigned to each individual team member. It is possible to specify days off for individual members as well as for the whole team (such as holidays). You can also specify how many hours a day each team member has available to work on the given sprint by clicking on tab ‘Capacity’.
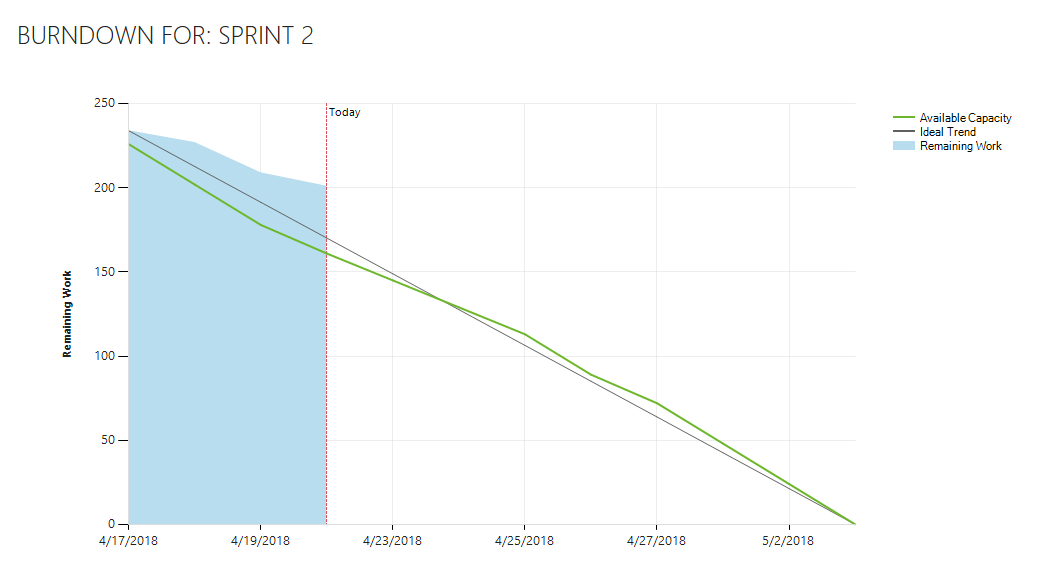
During the sprint, we primarily track progress using a so-called burn-down-chart:
As you can see in the chart above, as of today, our team is not on track to finish all work items assigned during the sprint.
Another useful metric is called ‘Velocity’. Velocity shows how many story points your team achieved in the past on average during a sprint and allows you to better plan new sprints.
We found that this process really helps us to stay on track and manage the complexity inherent in many data science projects.
All the best for your next project!


